Posted on

Automatic Identification System (AIS) on Ships

Automatic Identification System (AIS) Explanation:

  • Very simply, the Automatic Identification System is a broadcast transponder system, operating in the VHF maritime mobile band.
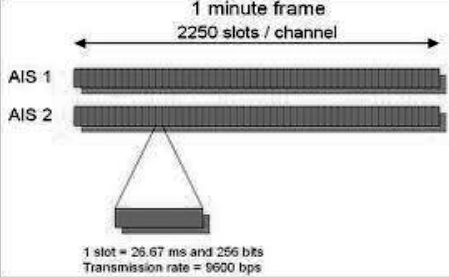
  • It is capable of sending information such as identification, position, course, speed and more, to other ships and to shore. AIS operates principally on two dedicated VHF frequencies or channels:

AIS 1 – 161.975 MHz – channel 87B (Simplex, for ship to ship)

AIS 2 – 162.025 MHz – channel 88B (Duplex for ship to shore)

Automatic Identification System AIS - Transmission
  • AIS uses Self-Organizing Time Division Multiple Access (SOTDMA) technology to meet this high broadcast rate and ensure reliable ship-to-ship operation. It normally works in an autonomous and continuous mode, regardless of whether it is operating in the open seas, coastal or inland areas.
  • Although only one radio channel is necessary, each station transmits and receives over two radio channels to avoid interference problems and to allow channels to be shifted without communications loss from other ships.
  • Each station determines its own transmission schedule (slot), based upon data link traffic history and knowledge of future actions by other stations.
  • A position report from one AIS station fits into one of 2250 time slots established every 60 seconds.
  • AIS stations continuously synchronize themselves to each other, to avoid overlap of slot transmissions.
  • Slot selection by an AIS station is randomized within a defined interval. When a station changes its slot assignment, it pre-announces both the new location and the timeout for that location.
  • In this way, new stations including those stations which suddenly come within radio range close to other vessels will always be received by those vessels.
  • Each AIS consists of on VHF transmitter, two VHF TDMA receivers, one VHF DSC receiver, and a standard marine electronic communications link to shipboard display and sensor systems.

Working of AIS:-

  • AIS is fitted with two receivers, one transmitter VHF DSC receiver Standard marine electronic communication link providing the various input data.
  • The AIS transmission uses 9.6 kb GMSK FM over 25 or 12.5kHz channel using HDLC Packet control.
  • Each AIS transmits and receives over two radio channel to avoid interference problems.
  • Each station determines its own transmission slot based on the data link traffic history and knowledge of future actions by other stations.
  • Range of AIS is about 20 NM.

Limitation of AIS:-

  • Small crafts may not be fitted with AIS
  • AIS might have switched off on other ship
  • Erroneous data might have entered
  • Accuracy of data received depend on the accuracy of data transmitted
  • Error in sensor’s input data,
  • Failure of sensors to provide data
  • Cell of vessel may be full

Precautions while using AIS in collision avoidance:-

  • AIS is an additional source of navigational information. It does not replace other navigational aids.
  • Should rely solely on AIS.
  • Watches must be kept as per STCW.
  • It does not have any impact on the composition of watch arrangement.
  • Swapping of targets.

Advantages of AIS:

  • AIS helps in collision avoidance with respect to situational awareness, AIS can calculate the CPA & TCPA which can be compared with ARPA.
  • Information regarding navigation status cane be beneficial.
  • By virtue of AIS vessels can be positively identified.
  • AIS reduced the work load associated with verbal reporting system required by the VTS.
  • AIS contributes to Maritime security, authorities can monitor the movement of the vessels, multiple AIS coast stations can be linked together to get the extended surveillance.
  • AIS can pick up targets even during heavy weather & restricted visibility especially due to rain etc.
  • AIS can pick up targets beyond small islands & bends.
  • Problem on target swap (for ARPA) will not be experienced in case of AIS.
  • No problem of range discrimination or bearing discrimination.
  • Pseudo AIS can be used to generate virtual buoys to indicate dangers.
  • AIS can also be installed on light houses, beacons for positive identification of these marks.
  • Pseudo AIS can also be used to generate target in case of SAR operations.
  • AIS can be used for meteorological & navigational information.
  • AIS can be interfaced with VDR, ECDIS & radar.

Limitations of AIS:

  • Small crafts may not be fitted with AIS
  • AIS might have switched off on other ship
  • Erroneous data might have entered
  • Accuracy of data received depend on the accuracy of data transmitted
  • Error in sensor’s input data,
  • Failure of sensors to provide data
  • Cell of vessel may be full

Precautions while using AIS in collision avoidance:

  • Do not rely on AIS as the sole  information  system, making use  of  all safety-relevant information available.
  • AIS is an additional source of navigational information. It does not replace other nav aids.
  • Watches must be kept as per STCW.
  • It does not have any impact on the composition of watch arrangement.
  • Swapping of targets.

Use of AIS in collision avoidance and SAR operations:

Use of AIS in Collision avoidance: AIS has potential to significantly contribute to safety of navigation. It provides positive identification of targets fitted with AIS along with their static and dynamic information.

This enhances the navigational effectiveness and it can greatly improve situational awareness and decision making abilities. AIS also assists OOW in tracking and monitoring targets, as it also provides information on CPA and TCPA.

Use of AIS in SAR operations:

  • SAR operations can be used for receiving messages from an AIS-SAR transmitter (SART), which have built in GPS receivers to derive accurate positioning information, on survival craft.
  • In combined aerial and surface searches AIS may allow the direct presentation of the position on other displays, such as radar, electronic chart systems and ECDIS.
  • AIS-SART facilitates the task of SAR craft in rescuing distressed seafarers.
  • For ships in distress without AIS, the on scene co-ordinator could create an AIS target.

Contents & broadcast intervals for each message type for a class A AIS:

  • A Class A AIS unit broadcasts the following information every 2 to 10 seconds while underway and every 3 minutes while at anchor at a power level of 12.5 watts.
  • The information broadcast includes:
    • MMSI number – unique reference able identification
    • Navigation status – not only are “at anchor” and “underway using engine“ currently defined, but “not under command” is also currently defined.
  • Rate of turn – right or left, 0 to 720 degrees per minute.
  • Speed over ground – 1/10 knot resolution from 0 to 102 knots.
  • Position accuracy – differential GPS or other and an indication if RAIM processing is being used Longitude – to 1/10000 minute and Latitude – to 1/10000 minute.
  • Course over ground – relative to true north to 1/10th degree.
  • True Heading – 0 to 359 degrees derived from gyro input.
  • Time stamp – The universal time to nearest second that this information was generated.
  • In addition, the Class A AIS unit broadcasts the following
  • information every 6 minutes:
    • MMSI number – same unique identification used above, links the data above to described vessel.
    • IMO number – unique reference able identification (related to ship’s construction).
    • Radio call sign – international call sign assigned to vessel, often used on voice radio.
  • Name – Name of ship, 20 characters are provided.
  • Type of ship/cargo – there is a table of possibilities that are available.
  • Dimensions of ship – to nearest meter.
  • Location on ship where reference point for position reports is located.
  • Type of position fixing device – various options from differential GPS to undefined.
  • Draught of ship – 1/10 meter to 25.5 meters [note “air-draught” is not provided].
  • Destination – 20 characters are provided.
  • Estimated time of Arrival at destination – month, day, hour, and minute in UTC.

AIS & LRIT Comparison:-

AISLRIT
SatelliteVHF
GlobalOnly where AIS coverage is provided
Secure DataPublic Data
Position, IMO Number, Date TimePosition, IMO Number, Date Time, Vessel Type, Speed, Course
Unlimited rangeLine of sight, up to 40NM
Flag State Owns DataAnyone can see data
Maritime Security and AwarenessNavigation and Anti-collision Tool

With Respect to AIS explain the followings: Dynamic Message

The dynamic data are sent as per the ship’s navigational status and speed and are as follows:

  • When at anchor every three minutes.
  • 0-14 kts-every 12 seconds
  • 14-23 kts-every 6 seconds
  • 14-23 kts and changing course every 2 seconds
  • 23+ kts every 2 seconds
Posted on

Global Positioning System (GPS) on Ships

Working of the Global Positioning System (GPS):

GPS or Global Positioning System is a satellite navigation system that furnishes location and time information in all climate conditions to the user. GPS is used for navigation in planes, ships, cars and trucks also. The system gives critical abilities to military and civilian users around the globe. GPS provides continuous real time, 3-dimensional positioning, navigation and timing worldwide.

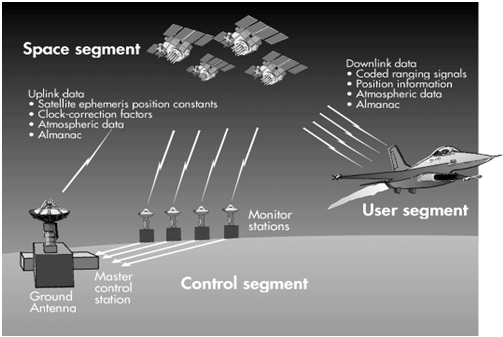
GPS System Working:- The GPS system consists of three segments:

  1. The space segment: the GPS satellites.
  2. The control system, operated by the U.S. military.
  3. The user segment, which includes both military and civilian users and their GPS equipment.

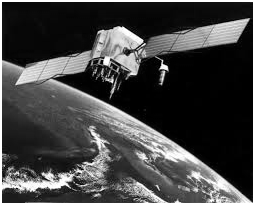
Space Segment of GPS:

  • The space segment is the number of satellites in the constellation. It comprises of 29 satellites circling the earth every 12 hours at 12,000 miles in altitude.
  • The function of the space segment is utilized to route/navigation signals and to store and retransmit the route/navigation message sent by the control segment.
    These transmissions are controlled by highly stable atomic clocks on the satellites.
  • The GPS Space Segment is formed by a satellite constellation with enough satellites to ensure that the users will have, at least, 4 simultaneous satellites in view from any point at the Earth surface at any time.
Space segment of GPS

GPS Control Segment:

  • The control segment comprises of a master control station and five monitor stations outfitted with atomic clocks that are spread around the globe.
  • The five monitor stations monitor the GPS satellite signals and then send that qualified information to the master control station where abnormalities are revised and sent back to the GPS satellites through ground antennas. Control segment also referred as monitor station.
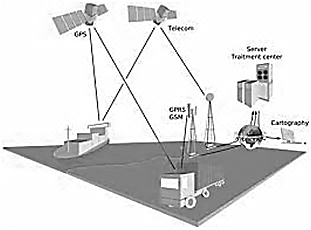
Control Segment of GPS

GPS User Segment:

  • The user segment comprises of the GPS receiver, which receives the signals from the GPS satellites and determine how far away it is from each satellite.
  • Mainly this segment is used for the U.S military, missile guidance systems, civilian applications for GPS in almost every field.
  • Most of the civilian uses this from survey to transportation to natural resources and from there to agriculture purpose and mapping too.
User Segment of GPS
User Segment of GPS

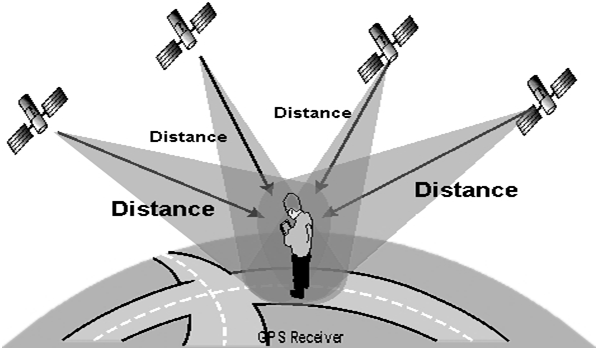
How GPS Determines a Position:

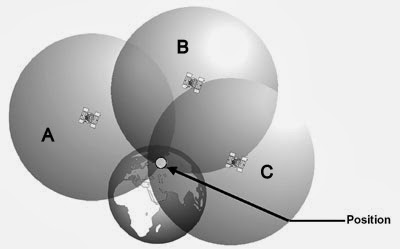
  • The working/operation of Global positioning system is based on the ‘trilateration’ mathematical principle.
  • The position is determined from the distance measurements to satellites. From the figure, the four satellites are used to determine the position of the receiver on the earth.
  • The target location is confirmed by the 4th satellite. And three satellites are used to trace the location place.
  • A fourth satellite is used to confirm the target location of each of those space vehicles. Global positioning system consists of satellite, control station and monitor station and receiver.
  • The GPS receiver takes the information from the satellite and uses the method of triangulation to determine a user’s exact position.
GPS Positioning

GPS Circuit: GPS is used on some incidents in several ways, such as:

  • To determine position locations; for example, you need to radio a helicopter pilot the coordinates of your position location so the pilot can pick you up.
  • To navigate from one location to another; for example, you need to travel from a lookout to the fire perimeter.
  • To create digitized maps; for example, you are assigned to plot the fire perimeter and hot spots.
  • To determine distance between two different points.

How a GPS receiver determines the ship’s position?

Position Fixing:
  • The receiver locks on to one satellite, and from this satellite it obtains the almanac of all the other satellites, and thereby selects the most suitable satellites for position fixing.
  • The position obtained by the receiver is basically by determining the distances from the receiver to each of the selected satellites.
  • The range measurement is achieved by measuring the propagation time from the selected satellite to the receiver.
  • Not possible to precisely synchronize satellite and receiver clock hence the pseudo ranges are obtained.
  • Hence an additional satellite is used to obtain the true ranges.
GPS Position Fixing of a ship
Equation for position fixing:-
  • R = C X (t-t2)
  • Range (R) of the satellite to the user.
  • Where C is the velocity of the radio waves and
  • (t-t2) = is the time difference (time taken for satellite signals to reach receiver.)

The satellite clock & the GPS clock may not be perfectly synchronized so this gives rise to an error in range measurement and the obtained is termed as pseudo range.

Hence, there are four unknowns i.e. latitudes, longitude, altitude (x, y, z co-ordinates) of the user as well as the user’s clock error with respect to satellite clock.

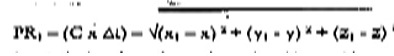
  • The position of the satellite S1 (x1, y1 , z1) is known to the user by the 30 sec navigational message and from this satellite the following equation is obtained:-
  • Where PR1 is the pseudo rage from satellite S1.
  • (Cx Δt) is error in range measurement due to the error in the user’s clock.
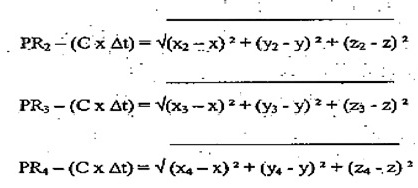
  • Since there are four unknown, they can be resolved from four equations obtained from four different satellites, the other 3 equations will be following:

With the help of these equations the 3D-fix can be obtained. In the case of a craft floating on water, a 2-D fix (i.e. Lat & long) is required and 3 equations from 3 satellites will be sufficient to fix position.


Precise Positioning Service (PPS) of GPS:

  • Authorised users have access to Precise Positioning Service.
  • The L1 frequency, transmitted by all Navstar satellites, contains a course/acquisition (C/A) code ranging signal, with a navigation data message, that is available for peaceful civil, commercial, and scientific use; and a precision (P) code ranging signal with a navigation data message, that is reserved for authorized use.
  • PPS predictably is 30 meters.

Standard Positioning Service (SPS) of GPS:-

  • Civil Users worldwide use SPS.
  • The L1 frequency, transmitted by all satellites, contains a coarse/ acquisition (C/A) code ranging signal, with a navigation data message, that is available for peaceful civil, commercial, and scientific use.
  • SPS predictability Accuracy: within 35 meters.
  • It is subject to selective availability, intentional down gradation of accuracy.
  • Now it has been announced by US Govt, that intentional down gradation will not be done.
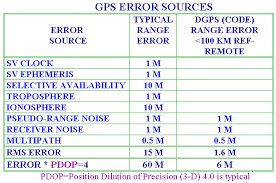
Errors of GPS:

GPS Errors Sources
  1. Atmospheric Error: Changing atmospheric conditions change the speed of the GPS signals as they pass through the Earth’s atmosphere and this affects the time difference measurement and the fix will not be accurate. Each satellite transmits its message on two frequencies and hence a dual frequency receiver receives both the frequencies and correction is calculated and compensated within the receiver thus increasing the accuracy of the fix.
    • Effect is minimized when the satellite is directly overhead.
    • Becomes greater for satellites nearer the horizon. The receiver is designed to reject satellites with elevation less than 9.5 degrees.
  2. User Clock Error: If the user clock is not perfectly synchronised with the satellite clock, the range measurement will not be accurate. The range measurement along with the clock error is called pseudo range. This error can be eliminated within the receiver by obtaining pseudo range from three satellites and is done automatically within the receiver.
  3. Satellite Clock Error: This error is caused due to the error in the satellite’s clock w.r.t. GPS time. This is monitored by the ground based segments and any error in the satellites clock forms part of the 30 seconds navigational message.
  4. GDOP Error: The GDOP of a satellite determines the angle of cut which in turn governs the quality of the position obtained. Wider the angular separation between the satellites, better the accuracy of the fix. Or, conversely said, the lower the GDOP value, the greater the accuracy of the fix. The GDOP value is indicated on the display unit.
  5. Multipath Error: This error is caused by the satellite signals arriving at the ship’s antenna both directly from the satellite and those that get reflected by some objects. Thus two signals are received simultaneously which will cause the distortion of signal from which range measurement is obtained. Siting the antenna at a suitable place can minimize this error.
  6. Orbital Error: The satellites are monitored and their paths are predicted by the ground based segment. However, between two consecutive monitoring of the same satellite, there may be minor drifts from their predicted paths resulting in small position inaccuracy.

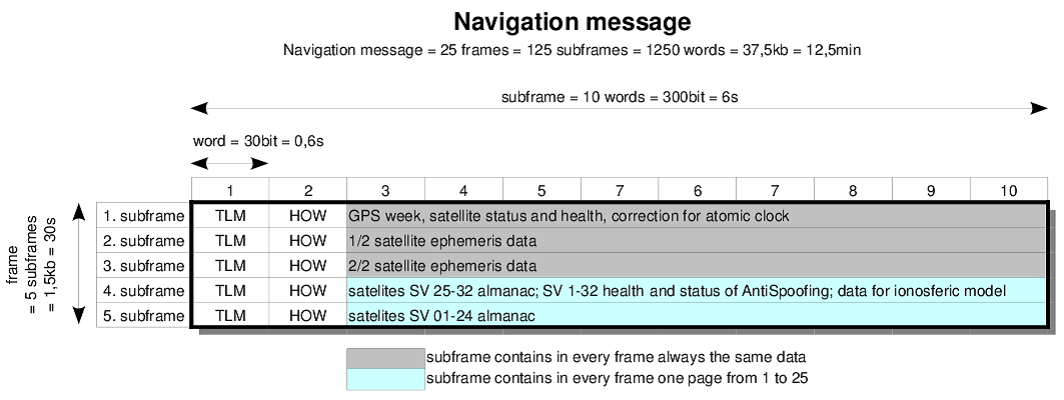
Contents of Navigation Message transmitted by the GPS satellites:

Navigation Message: Essential purpose of the navigation message transmission by satellites is to determine its position by the GPS receiver. Each satellite transmits a navigational message of 30 seconds in the form of 50 bps data frame. This data, which is different for each satellite, is previously supplied to the satellites by master control station and is divided into 5 sub-frames.

Each sub-frame commences with telemetry word (TLM) containing satellite status followed by hand over word (HOW) data for acquiring P code from C/A code.

Navigational Message of GPS

The sub-frames are:

  • The 1st sub-frame contains data relating to satellite clock correction.
  • The 2nd and 3rd sub-frames contain the satellite ephemeris defining the position of the satellite.
  • The 4th sub-frame passes the alpha-numeric data to the user and will only be used when upload station has a need to pass specific messages.
  • The 5th sub-frame gives the almanac of all the other satellites which includes the identity codes thus allowing the user the best choice of satellites for position fixing.

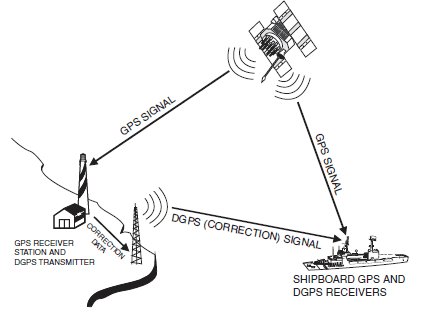
Differential GPS (DGPS) enhances the accuracy of the ship’s position:

Differential GPS (DGPS) is a system in which differences between observed and computed co-ordinates ranges (known as differential corrections) at a particular known point are transmitted to users (GPS receivers at other points) to upgrade the accuracy of the users receivers position.

Differential Correction:- Differential correction is a technique that greatly increases the accuracy of the collected DGPS data. It involves using a receiver at a known location – the “base station“ and comparing that data with DGPS positions collected from unknown locations with “roving receivers.”

Limitation & Errors of DGPS:-

  1. International Limitation of Accuracy
  2. Receiver Independent Exchange Format
  3. Reference System Co-ordinates

Methods used to Transmit Corrections:-

  • Computing & transmitting – a position correction in terms of Lat, Long & altitude i.e. x, y, z co-ordinates.
  • Computation of pseudo range correction to each satellite which is then broadcasted to the user and applied to the user’s pseudo range measurement before the position is calculated by the onboard receiver resulting in a higher accuracy of position fix.
  • DGPS removes common-mode errors, those errors common to both the reference and remove receivers (not multipath or receiver noise). Errors are more often common when receivers are close together (less than 100 km). Differential position accuracies of 1-10 meters are possible with DGPS based on C/A code SPS Signal.
Differential GPS enhances the accuracy of the ship’s position

Explanation of how the DGPS calculate even more accurate position than the GPS:

  • Differential Global Positioning System (DGPS) is an enhancement to Global Positioning System that provides improved location accuracy, from the 15-meter nominal GPS accuracy to about 10 cm in case of the best implementations.
  • DGPS uses a network of fixed ground-based reference stations to broadcast the difference between the positions indicated by the GPS satellite systems and the known fixed positions.
  • These stations broadcast the difference between the measured satellite pseudo ranges and actual (internally computed) pseudo ranges, and receiver stations may correct their pseudo ranges by the same amount.
  • The digital correction signal is typically broadcast locally over ground-based transmitters of shorter range.

Geodetic Datum:

A geodetic datum or geodetic system is a coordinate system, and a set of reference points, used for locating places on the Earth (or similar objects). Datums are used in geodesy, navigation, and surveying by cartographers and satellite navigation systems to translate positions indicated on maps (paper or digital) to their real position on Earth. Each starts with an ellipsoid (stretched sphere), and then defines latitude, longitude and altitude coordinates. One or more locations on the Earth’s surface are chosen as anchor “base-points”.

Pseudo Range:

The Pseudo Range is the pseudo distance between a satellite and a navigation satellite receiver for instance Global Positioning System (GPS) receivers. To determine its position, a satellite navigation receiver will determine the ranges to (at least) four satellites as well as their positions at time of transmitting. Knowing the satellites’ orbital parameters, these positions can be calculated for any point in time. The Pseudo Ranges of each satellite are obtained by multiplying the speed of light by the time the signal has taken from the satellite to the receiver. As there are accuracy errors in the time measured, the term pseudo-ranges is used rather than ranges for such distances.

True Range:

True Range is an instantaneous measurement of the distance between the transmit antenna on the SV and receive antenna on the vehicle.  If it were possible imagine a tape measure stretched out between the two antennas, this measurement is the true range.


Geometric Dilution of Precision (GDOP):

Explanation:-

  • Dilution of precision (DOP), or geometric dilution of precision (GDOP), is a term used in satellite navigation and geomatics engineering to specify the additional multiplicative effect of navigation satellite geometry on positional measurement precision.
  • DOP can be expressed as a number of separate measurements:
    • HDOP – horizontal dilution of precision
    • VDOP – vertical dilution of precision
    • PDOP – position (3D) dilution of precision
    • TDOP – time dilution of precision
  • These values follow mathematically from the positions of the usable satellites. Signal receivers allow the display of these positions (skyplot) as well as the DOP values.
  • The term can also be applied to other location systems that employ several geographical spaced sites. It can occur in electronic-counter-counter-measures (electronic warfare) when computing the location of enemy emitters (radar jammers and radio communications devices). Using such an interferometry technique can provide certain geometric layout where there are degrees of freedom that cannot be accounted for due to inadequate configurations.
  • The effect of geometry of the satellites on position error is called geometric dilution of precision and it is roughly interpreted as ratio of position error to the range error. Imagine that a square pyramid is formed by lines joining four satellites with the receiver at the tip of the pyramid. The larger the volume of the pyramid, the better (lower) the value of GDOP; the smaller its volume, the worse (higher) the value of GDOP will be. Similarly, the greater the number of satellites, the better the value of GDOP.

HDOP with respect to GPS:

HDOP: Acronym for horizontal dilution of precision. A measure of the geometric quality of a GPS satellite configuration in the sky. HDOP is a factor in determining the relative accuracy of a horizontal position. The smaller the DOP number, the better the geometry.


GPS receiver determining the speed of the ship:

Explanation:

  • The carrier frequency is also used to determine the speed of the user by the measurement of Doppler shift, i.e. change in the frequency of radio waves received when the distance between the satellite and user is changing due to the relative motion between the two.
  • The position and velocity of the satellite as well as the position of the user are known to the user’s receiver.
  • The velocity vector of the satellite can be resolved in two ways:
    • In the direction towards the user
    • In the direction perpendicular to (i).
  • The 2nd component is not considered as speed in this direction will not cause Doppler shift.
  • The receiver calculates the velocity vector of the satellite in the direction towards the user.
  • If the relative approach speed between the satellite and the user’s speed (based on the Doppler shift measurement) is not equal to the satellite speed vector towards the user; the difference can only arise due to user’s speed towards or away from the satellite.
  • Similarly with the help of the other two satellites, the receiver can calculate two additional speed vectors and these speed vectors will be towards or away from their respective satellites.
  • These velocity vectors are resolved into three other vectors, i.e. x, y and z co-ordinates and with these three vectors the course and speed of the user is calculated.

GPS System configuration and frequencies used for: P & C/A code:

Codes:- Each satellite transmits two codes:-

  • P Code (Precession Code) that is only available to US military and its allies.
  • C/A Code (Coarse Acquisition Code) available for use to all civilian users.

Frequencies:- 1575.42 MHz (L1 signal) and 1227.6 MHz (L2 signal).

  • The L1 carrier consists of both the C/A and P codes, while the L2 carrier consists the P code only.
  • Each satellite transmits pseudo random noise signals on these two different frequencies.

Function of these codes is as follows:

  • For satellite identification since each satellite has a unique code.
  • For measurement of the propagation time from the satellite to user.

The C/A code:-

  • The C/A code is different for every satellite.
  • The C/A code is made up of sequences called chips.
  • Sequence repeats itself every millisecond.
  • The C/A code is for the civilians.
C_A Code of GPS on ships

P code:-

  • The full code length is of 267 days.
  • The extremely long code length makes it difficult to lock on to the P code.
  • P code is available only for US & allies.
  • P code is different for every satellite.

Alarms of GPS on Ships:

Alarms of GPS:- There are seven alarm conditions which generate both audible and visual alarms. When an alarm setting is violated, the buzzer sounds and the name of the offending alarm appears on the display. The alarm icon also appears on the Plotter 1, Plotter 2 and Highway displays.

  1. Arrival Alarm, Anchor Watch Alarm:-
    • Arrival alarm:- The arrival alarm informs you that own ship is approaching a destination waypoint. The area that defines an arrival zone is that of a circle which you approach from the outside of the circle.
    • Anchor watch alarm:- The anchor watch alarm sounds to warn you that own ship is moving when it should be at rest.
  2. Cross Track Error (XTE) Alarm :- The XTE alarm warns you when own ship is off its intended course.
  3. Ship’s Speed Alarm:- The ship’s speed alarm sounds when ship’s speed is lower or higher (or within) the alarm range set.
  4. Trip Alarm:-  The trip alarm sounds when the distance run is greater than the trip alarm setting.
  5. Water Temperature Alarm:- The water temperature alarm sounds when the water temperature is higher or lower (or within) the preset temperature. This alarm requires temperature signal from external equipment.
  6. Depth Alarm:- The depth temperature alarm sounds when the depth is higher or lower (or within) the preset depth. This alarm requires video sounder connection.
  7. WAAS/DGPS Alarm:- The WAAS/DGPS alarm sounds when the WAAS/DGPS signal is lost. This alarm may be enabled or disabled as below.

Chart Datum – Explanation:

Chart Datum (CD) is defined simply in the Glossary as the level below which soundings are given on Admiralty charts. CDs used for earlier surveys were based on arbitrary low water levels of various kinds.

Modern Admiralty surveys use as CD a level as close as possible to Lowest Astronomical Tide (LAT), which is the lowest predictable tide under average meteorological conditions. This is to conform to an IHO Technical Resolution which states that CD should be set at a level so low that the tide will not frequently fall below it.

The actual levels of LAT for Standard Ports are listed in Admiralty Tide Tables. On larger scale charts, abbreviated details showing the connection between chart datum and local land levelling datum are given in the tidal panel for the use of surveyors and engineers, where those connections are known.

Datums in use on charts:-

Large scale modern charts contain a panel giving the heights of MHWS, MHWN, MLWS and MLWN above CD, or MHHW, MLHW, MHLW and MLLW, whichever is appropriate, depending on the tidal regime in the area concerned. The definitions of all these terms are given in the Glossary. If the value of MLWS from this panel is shown as 0·0 m, CD is the same as MLWS and is not therefore based on LAT. In this case tidal levels could fall appreciably below CD on several days in a year, which happens when a CD is not based on LAT.

Other charts for which the UKHO is the charting authority are being converted to new CDs based on LAT as they are redrawn. The new datum is usually adopted in Admiralty Tide Tables about one year in advance to ensure agreement when the new charts are published. When the datum of Admiralty Tide Tables thus differs from that of a chart, a caution is inserted by Notice to Mariners on the chart affected drawing attention to the new datum.

Where foreign surveys are used for Admiralty charts, the chart datums adopted by the hydrographic authority of the country concerned are always used for Admiralty charts. This enables foreign tide tables to be used readily with Admiralty charts. In tidal waters these CDs may vary from Mean Low Water (MLW) to lowest possible low water. In non–tidal waters, such as the Baltic, CD is usually Mean Sea Level (MSL). Caution. Many CDs are above the lowest levels to which the tide can fall, even under average weather conditions. Charts therefore do not always show minimum depths.

For further details, see the relevant Admiralty Tidal Handbook.


Posted on

Bridge Navigational Watch Alarm System (BNWAS) on Ships

Bridge Navigational Watch Alarm System (BNWAS)

Purpose of BNWAS:-

  • The purpose of a bridge navigational watch alarm system is to monitor bridge activity and detect operator disability which could lead to marine accidents.
  • The system monitors awareness of the Officer of the Watch (OOW) and automatically alerts the Master or another qualified person if, for any reason, the OOW becomes incapable of performing OOW duties.
  • This purpose is achieved by series of indications and alarm to alert first the OOW and, if he is not responding, then to alert Master or another qualified person.
  • Additionally, the BNWAS provides the OOW with means of calling for immediate assistance if required.

Operational Modes of BNWAS

Operational Modes of BNWAS:-

BNWAS should incorporate the following 3 operational modes:

  1. Automatic
  2. Manual ‘ON’
  3. Manual ‘OFF’
  1. Automatic: The BNWAS is automatically activated when the vessel is navigating by means of heading or track control system (autopilot / trackpilot) and inhibited when this system is deactivated.
  2. Manual ON: The BNWAS is always in operation.
    • Authorized person (Master) switches on system by single turning the key-switch to position “ON/OFF”.
    • Once dormant period (3 min, 9 min, 12 min) is set, the authorized person pulls out the key.
    • Dormant period starts from the moment the system has been switched on.
  3. Manual OFF: The BNWAS is turned off completely.

ALERT SEQUENCE: – If dormant period is over without the OOW resetting, the system activates all reset units by flash light.

ALERT STAGE 1:- If dormant period and flash light period (15 sec) are over and the OOW has not yet resetted the button, the system activates electronic buzzer on terminal board as well as additional buzzers located on the bridge and wing area.

ALERT STAGE 2:- If dormant period, flash light period (15 sec) and alert stage 1 (15 sec) are over without OOW’s reset, system activates further alert via optic / acoustic alarm devices in officer’s area (cabins or staircase) as well as for VDR link.

ALERT STAGE 3:- If dormant period, flash light period (15 sec), alert stage 1 (15 sec) and alert stage 2 (90 sec) are over without OOW’s reset, the system activates the General Alarm as well as for VDR link.

EMERGENCY CALL:-

  • The OOW generates an emergency call by pushing any reset unit longer than 5 sec.
  • That immediately activates alert stage 2 and subsequently alarm stage 3.
  • After emergency call has been released, reset is possible by pushing a reset unit.

Requirements of BNWAS:-

  • The bridge navigational watch alarm system shall be in operation whenever the ship is underway at sea.
  • System is powered by ships main power and MUST have a battery back up giving a minimum of 6 hours usage.

Carriage Requirements of Bridge Navigational Watch Alarm System (BNWAS):-

  1. Cargo ships of 150 grt and upwards and passenger ships irrespective of size constructed on or after 1 July 2011;
  2. Passenger ships irrespective of  size constructed before 1 July 2011, not later than the first survey after 1 July 2012;
  3. Cargo ships of 3000 grt and upwards constructed before 1 July 2011, not later than the first survey after 1 July 2012;
  4. Cargo ships of 500 grt and upwards but less than 3000 grt constructed before 1 July 2011, not later than the first survey after 1 July 2013; and
  5. Cargo ships of 150 grt and upwards but less than 500 grt constructed before 1 July 2011, not later than the first survey after 1 July 2014.

Posted on

Echo Sounder on Ships

Basic Principles of Echo Sounder:

Short pulses of sound vibrations are transmitted from the bottom of the ship to the seabed. These sound waves are reflected back by the seabed and the time taken from transmission to reception of the reflected sound waves is measured. Since the speed of sound in water is about 1500 m/sec, the depth of the sea bed is calculated which will be half the distance travelled by the sound waves.

Principles of Echo Sounder

        The received echoes are converted into electrical signal by the receiving transducer and after passing through to stylus which burns out the coating of the thin layer of aluminum powder and produces the black mark on the paper indicating the depth of seabed.

Components of Echo Sounder:

Components of Echo Sounder
  • Basically an echo sounder has following components:
  • Transducer – to generate the sound vibrations and also receive the reflected sound vibration.
  • Pulse generator – to produce electrical oscillations for the transmitting transducer.
  • Amplifier – to amplify the weak electrical oscillations that has been generated by the receiving transducer on reception of the reflected sound vibration.
  • Recorder – for measuring and indicating depth.

CONTROLS:-

  • An echo sounder will normally have the following controls:
  • Range Switch – to select the range between which the depth is be checked e.g.  0- 50 m, 1 – 100 m, 100 – 200 m etc.  Always check the lowest range first before shifting to a higher range.
  • Unit selector switch – to select the unit feet, fathoms or meter as required.
  • Gain switch – to be adjusted such that the clearest echo line is recorded on the paper.
  • Paper speed control – to select the speed of the paper – usually two speeds available.
  • Zero Adjustment or Draught setting control – the echo sounder will normally display the depth below the keel.  This switch can be used to feed the ship’s draught such that the echo sounder will display the total sea depth.  This switch is also used to adjust the start of the transmission of the sound pulse to be in line with the zero of the scale in use.
  • Fix or event marker – this button is used to draw a line on the paper as a mark to indicate certain time e.g. passing a navigational mark, when a position is plotted on the chart etc.
  • Transducer changeover switch – in case vessel has more than one switch e.g. forward and aft transducer.
  • Dimmer – to illuminate the display as required.

Working:

  • The acoustic pulses of very short duration are transmitted vertically at the rate of 5 to 600 pulses per minute having a beam width of 12 to 25°.
  • These pulses strike the seabed and get reflected back towards the receiving transducer as echoes.
  • These received echoes are converted into electrical signals by the receiving transducer and after passing through the different stages of the receiver, the current is supplied to the stylus which bums out the coating of the thin layer of aluminium powder and produces a black mark on the paper indicating the depth of the seabed.

Principle used in the working of an Echo Sounder:-

There are two techniques:-

  • Ranging
  • Phasing

Ranging:-

  • In echo sounder the stylus is mounted on circular belt driven by means of a stylus motor which moves at certain speed and transmission takes place when the stylus passes the zero marks.
  • A magnet fixed on the stylus belt triggers the transmitter to transmit a pulse every rotation of belt when stylus is at zero mark on the paper scale, the transmission of the acoustic waves from the transducer is synchronized with the stylus at the zero mark.
  • The acoustic waves are reflected from the seabed and echoes are received by the transducer and after passing through various stages eventually the current is supplied to stylus which burns out the coating of the thin layer of aluminum powder and produces the black mark on the paper indicating the depth of seabed.
  • This cycle is repeated for every rotation so as the paper is pulled across the display, the profile of seabed is obtained.
  • Suppose the lowest range scale is 0 to 50 M, the transmission will take place when stylus reaches at the zero mark.
  • When the higher range is selected say 0 to 100 M, in order to cater for this range scale, the speed of the stylus motor is reduced, in this process the scale magnification is lost and as we switch over to higher ranges the scale becomes more & more congested.
  • To overcome this problem some of echo sounding machines work on phasing technique.

Phasing:-

  • In phasing the speed of the stylus motor remains constant.
  • Instead of changing the speed of the stylus, the transmission point is advanced.
  • If the first range is 0 to 50 M the second range will be 50 to 100 M (instead of 0 to 100 M).
  • Various sensors are positioned around the stylus belt, the magnet generates the pulse when it passes the sensors which in turns activates the transmitter.
  • In the below diagram, when we select the lowest range i.e. 0 to 50 M, the magnet mounted on the stylus belt will activate sensor no. 1, transmission takes place when the stylus exactly passes over the zero mark, when we switch over to higher range, say 50 to 100 M, the magnet mounted on the stylus belt will activate sensor no.2 and transmission will take place early, at the time of the transmission, the stylus will not be passing over 50 M mark on display unit, in other words there will be delay introduced by delay unit no.2 & the stylus will reach the 50 M on display unit after delay of 0.067 seconds. (50 x 2 / 1500, where 50 correspond to the range, multiplied by 2 because double of distance is covered by acoustic waves & the echoes and 1500 is the speed of acoustic waves).
  • Likewise, when we switch over to higher range say, 100 to 150 M, magnet mounted on the stylus belt will activate sensor no. 3 & more delay will be introduced for the stylus to pass over the 100 M.
Working of an Echo Sounder

Caution when using phasing technique: – We must always start sounding at lowest range and check for echoes, adjust the gain control if required and then only switch over to higher range.


Errors of Echo Sounder:

  • Velocity of propagation in water:- The velocity changes with temperature salinity & pressure. The velocity of the acoustic wave assumed at the temperature of 16 degree C & Salinity of 3.4% is 1505 m/sec, but generally it is taken as 1500 m/sec for calculations. As velocity is varying hence depth recorded will be erroneous. Depth indicated in Fresh water can be about 3% higher than the actual depth. NP 139 can be referred in order to obtain the corrections. To compensate the error due to temperature variation, a component called “thermistor” may be mounted near the transducer & change in velocity of the acoustic wave through water from the standard value due to the change in sea water temperature is accounted for. Error due to pressure is not so significant.
  • Stylus speed error:- The speed of the stylus is such that the time taken by the stylus to travel from top to bottom on chart is same as the time taken by sound waves to travel twice the range selected, but due to fluctuation in voltage supplied to stylus motor, will cause error in the recorded depth.
  • Pythagoras error:- This error is found when two transducers are used, one for transmission and the other one for reception. This error is calculated using the Pythagoras principle. This error becomes prominent whenever distance between two transducer is more than 2 mtrs, manual should be referred in order to use the table for corrections.
  • Multiple echoes:- The echo may be reflected no. of times from the bottom of the sea bed, hence providing the multiple depth marks on paper.
  • The thermal and density layers:- The density of the water varies with temperature and salinity, which all tends to form different layers. The sound wave may be reflected from these layers.
  • Zero line adjustment error:- If the zero is not adjusted properly, it will give error in reading.
  • Cross noise:- If sensitivity of the amplifier is high, just after zero marking a narrow line along with the several irregular dots and dashes appear and this is called cross noise. The main reasons for the cross noise are aeration and picking up the transmitted pulse. If intensity of cross noise is high, it will completely mask the shallow water depths. This is controlled by swept gain control circuit.
  • Aeration:- When the sound wave is reflected from the reflected from the air bubbles, it will appear as dots, this is known as aeration.
    • Aeration can be due to pockets of bubble due to heavy weather.
    • Rudder hard over causing drastic alteration of course.
    • Pitching in light condition.
    • Whilst astern propulsion. (Switch over to forward transducer if available.)

Electrostrictive Transducer with respect to Echo Sounder:

Electrostrictive Transducer
Electrostrictive Transducer (credit)
  • This type of transducer works on the basic principle of piezo-electric effect, i.e., certain crystals such as quartz, have a property that when pressure is applied to the two opposite faces, a difference of potential is created which is proportional to the applied pressure or when an alternating voltage is applied,
    the crystals start vibrating or oscillating. This type of transducer is also known as Piezostrictive transducer.
  • The electrostrictive transducer uses the property of a crystal for transmission and reception of acoustic waves in water. The crystal is firmly fixed between two steel plates so that they act as a single unit.
  • The purpose of the steel plates is to provide solid and robust housing for the crystal as well as a suitable contact surface for seawater.
  • When an alternating voltage is applied between the steel plates, the quartz and the steel plates start vibrating together. The vibration will be of very high amplitude, if the frequency of the alternating voltage is equal to the resonance frequency of the crystal. The lower of the two steel plates is in direct contact with the water, which will cause the vibration in the seawater.
    The vibration is always perpendicular to the plate and hence always kept horizontally.
  • Generally, only one transducer is used for transmission and reception of the signals and this transducer is always mounted as pierced hull.
Posted on

Electromagnetic Speed Log on Ships

Principle & working of Electromagnetic Speed Log:

Electromagnetic Speed Log - Effect of moving a conductor through magnetic field
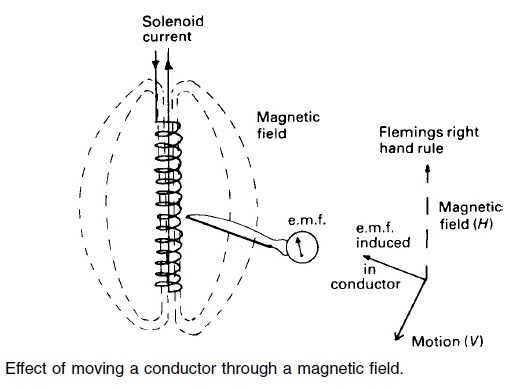
  • The electromagnetic speed log is based is upon the induction law, which states that if a conductor moves across a magnetic field, an electro motive force (e.m.f.) is set up in the conductor.
  • Alternatively, the e.m.f. will also be induced if the conductor remains stationary and the magnetic field is moved with respect to it.
  • The induced e.m.f. is directly proportional to the velocity.
    • Velocity when integrated with time gives distance
    • The induced e.m.f. ‘E’ is given by the following:
      • E = F X L X V
    • Where F = magnetic field
    • L = the length of the conductor
    • V = the velocity of the conductor through the magnetic field.
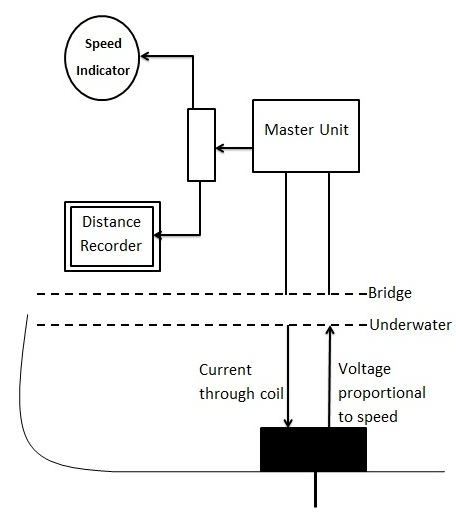
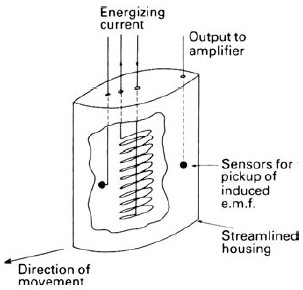
Constructional Details of an electromagnetic log sensor: This type of log consists of
  1. Sensor
  2. Amplifier
  3. Indicator
Electromagnetic Log Sensor - Construction Detail

Working of Electromagnetic Speed Log:

  • An Electromagnet consisting of a coil carrying alternative Current (A.C.) generates a vertical magnetic field in the water around the probe. The SW Conductor moving horizontally through this magnetic field has an electromotive force induced into it proportional to the seed of the vessel. In the EM log the ‘F’ and ‘L’ are maintained constant, therefore the induced e.m.f. is directly proportional to the velocity ‘V’, which is the velocity of the vessel through the water. The speed output from an EM log depends upon the water flow by way of the sensors. This type of log can give only speed through water and is greatly affected by the current flowing under the ship. The induced e.m.f. and hence the speed indication will vary with the conductivity of the water. This e.m.f. is picked up by 2 electrodes. This induced e.m.f. is very small hence the amplification is required. The amplified signal thus drives the mechanism which is connected to indicator. Hence, the induced e.m.f. which is directly proportional to the velocity is finally displayed on the indicator.
Working of Electromagnetic Log

More information:-

  • The Log Extends up to about 20 cm outside the hull.
  • It should be retracted in case of reduced UKC & before proceeding to dry dock.
  • Normally retracted from the engine room.
  • If sensors are also fitted athwartship, the speed in athwartship direction also can be displayed.

Errors / Limitations of Electromagnetic Speed Log:

  • Siting of the probe is critical. This is so since if too close to the hull then due to the non-linearity of the hull form the speed of the water flow may give a wrong representation of the vessels speed. This is minimized by careful siting of the sensor as well as by calibrating the instrument while installation.
  • Pitching and Rolling also give rise to errors however these are reduced by having an electrical time constant that is longer than a period of vessel motion. A well-adjusted log can have an accuracy of better than 0.1 percent of the speed range.
  • Sign of Speed, it can show astern speed as well, but without sign if AC current is used, if DC current is used to create the magnetic field it will show sign of speed range. This type of log can give only speed through water and is greatly affected by the current flowing under the ship.
  • While navigating in area with greater current, one must exercise precautions.

Advantages of Electro-magnetic log with Doppler log:

  • No moving parts
  • Less affected by sea growth than Pit sword

Disadvantages of Electro-magnetic log with Doppler log:

  • Salinity and temperature of water affects calibration.
  • Measurements affected by boundary layer, (water speed slowed down close to the hull by friction).
  • Provides boat/ship speed relative to water not ground. Current affects accuracy.

Difference between “Water Track Speed” and “Ground Track Speed“:

Water Track Speed:- In open seas, the sound pulse from the Doppler transducer may not reach the bottom, but get totally internally reflected from a layer of water in between. This is known as the echo from the ‘Water Track”. When the sound is bounced off a water layer, called a water track, speed indicated is the ‘Speed through Water”. or from a layer of water and the echo is at a higher frequency. The frequency of the echo from the water track will follow the same Doppler principles as the echo from the bottom track. However, the speed measured from the ‘water Track’ will not be ‘Speed over the Ground’, but it will be ‘Speed through Water’.

Ground Track Speed:- Speed over ground is the speed of the ship with respect to the ground or any other fixed object such as fixed buoy or island. Speed through water is the speed of the ship with respect to the water such as anything floating on water. A ship with her engine stopped in water with 2 knots currents will have zero speed through water but will have 2 knots speed over ground.


Posted on

Doppler Log on Ships

Principle & Working of Doppler Log: 

Doppler Effect from a Moving Source
  • Equipment
    to measure ship’s speed.
  • The
    Doppler log is based on measurement of the Doppler effect.
  • The
    Doppler effect can be observed for any type of wave – water wave, sound wave,
    light wave, etc. we are most familiar with the Doppler effect because of our
    experiences with sound waves. For instance, a police car or emergency vehicle
    was travelling towards us on the highway. As the car approached with its siren
    blasting, the pitch of the siren sound (a measure of the siren’s frequency) was
    high; and then suddenly after the car passed by, the pitch off the siren sound
    was low. That was the Doppler Effect – an apparent shift in frequency for a
    sound wave produced by a moving source.
  • The Doppler Effect is a frequency shift that results
    from relative motion between a frequency source and a listener.
  • If
    both source and listener are not moving with respect to each other (although
    both may be moving at the same speed in the same direction), no Doppler
    shift will take place.
  • If
    the source and listener are moving closer to each other, the listener will
    perceive a higher frequency – the faster the source or receiver is
    approaching the higher the Doppler shift.
  • If
    the source and listener are getting further apart, the listener will perceive a
    lower frequency – the faster the source or receiver is moving away the lower
    the frequency.
  • So,
    the Doppler shift is directly proportional to speed between source and
    listener, frequency of the source, and the speed the wave travels.

Explanation of how ship’s speed is transmitted to remote displays:

Block Diagram of Doppler Speed Log
  • Distance recording is achieved by using a constant speed motor (10) which drives the distance counter (11), via friction gearing.
  • The constant speed motor has been used in order that a distance indication may be produced that is independent of the non-linear characteristic of the system.
  • The motor is started by contact (5) as previously described.
  • The main shaft (7), whose angle of rotation is directly proportional to the speed of the ship, is fitted with a screw spindle (12).
  • The rotation of the shaft causes a lateral displacement of the friction wheel (13). At zero speed, the friction wheel rests against the apex of the distance cone (14), whilst at maximum speed the wheel has been displaced along the cone to the rim.
  • The distance indicator (11) is driven from the constant speed motor (10) via the cone.
  • The nearer to the rim of the cone the friction wheel rides, the greater will be the distance indication.
  • Revolutions of the distance shaft (15) are transmitted to the remote distance indicator via the servo transmission system (16 and 17).
  • The speed unit provides the following outputs to drive both speed and distance counters:-
    • An analogue voltage, the gradient of which is 0.1 V/knot, to drive the potentiometer servo-type speed indicators.
    • A pulse frequency proportional to speed.
    • The frequency is 200/36 pulses/s/knot. Pulses are gated into the digital counter by a 1.8-s gate pulse.
    • A positive/negative voltage level to set the ahead/astern indication or the B track/W track indication.
    • 2000 pulses per nautical mile to drive the stepping motor in the digital distance indicator.

FORMULA of Doppler Log:-

  • Doppler effect can be further explained by following equations:
    • fr is the frequency received by observer.
    • ft is the transmitted frequency.
    • c is the speed of sound.
    • vO is Velocity of observer
    • vg is Velocity of source
  • If the source moves towards stationary observer, fr = c ft / (c – vg)
  • If the source moves away stationary observer, fr = c ft / (c + vg)
  • If the observer moves towards stationary source, fr = ft (c + vg) / c
  • If the observer moves away from stationary observer, fr = ft (c – vg) / c
  • If the observer & source moves away from each other, fr = ft (c – vg) / (c + vs)
  • If the observer & source moves toward each other, fr = ft (c + vg) / (c – vs)
  • Since,
    in the case of the Doppler log, the source & observer are the same.

Hence,

vO is equal to vS, is equal to v

fr = ft (c+ v) / (c – v)

Principles of Doppler Log

fr = ft (c+ v cos a) / (c – v cos a)

After Further simplification

v = c (fr – ft) / 2 ft cos a

  • Given
    a propogation angle of 60O, cos a = 0.5 (using single transducer
    facing forward)
  • Graphs
    of speed error caused by variations of the vessel’s trim:
Trim Angle in Degrees - Doppler Log
  • It
    follows that if the angle changes, the speed calculated will be in error
    because the angle of propagation has been applied to the speed calculation
    formula in this way. If the vessel is not in correct trim (or pitching in heavy
    weather) the longitudinal parameters will change and the speed indicated will
    be in error.
  • To
    counteract this effect to some extent, two acoustic beams are transmitted, one
    ahead and one astern. The transducer assembly used for this type of
    transmission is called a ‘Janus’ configuration after the Roman god who
    reputedly possessed two faces and was able to see into both the future and the
    past.
Working of a Doppler Log

After installing transducer facing aft, the Doppler frequency shift formula now becomes:-

        Frt – fra – 4 vft cos a / c

Hence, v = c (frt – fra) / 4 ft cos a

  • Therefore
    the transmission angle can effectively be ignored.
  • The
    advantage of having a Janus configuration over a single transducer arrangement.
    It can be seen that a 3O change of trim on a vessel in a forward
    pointing Doppler system will produce a 5 % velocity error. With a Janus
    configuration transducer system, the error is reduced to 0.2% but is not fully
    eliminated.
Trim Angle in Degrees - Doppler Log
  • The addition of a
    second transducer assembly set at right angles to the first one, enables dual
    axis speed (longitudinal speed and transverse speed) to be indicated.
Working of a Doppler Log

Docking Operation:

  • The placing of the Janus configuration in a fore and aft direction is known as a single axis system and is used to calculate speed over ground in the forward and after direction. A dual axis system places a second grouping of Janus configured transducers in an athwart ships direction allowing for the calculation of a vessel’s speed when moving sideways through the water, as in docking. The beam width of the athwart ship installation is about 8 degrees to account for the possibility of a vessel’s rolling.
  • The Doppler system calculates speed to within an accuracy of about 0.5 percent of the distance traveled. It functions well for all speeds that modern vessels can attain and works from a minimum depth of about 1.5 feet to a maximum depth of about 600 feet. Frequencies employed are between 100 kHz and 600 kHz. There are primarily four errors to be aware of when using the Doppler system:
    • Transducer orientation error caused when the pitching or rolling of the vessel becomes excessive.
    • Vessel motion error caused by excessive vibration of the vessel as it moves through the water.
    • Velocity of sound errors due to changes in water temperature or den­sity due to salinity and particle content.
    • Signal loss errors caused by attenuation of the vibrations during tran­sit through the water or upon reflection from the bottom.
  • The Doppler system normally measures speed over ground to about 600 feet. This depth signals may be returned by a dense, colder layer of water located throughout the oceans called the deep scattering layer (DSL). Signals received off the DSL are not as accurate as signals received from bottom reflections but can still be used to provide an indication of speed through the water instead of speed over ground when bottom tracking. Your unit may have a manual or automatic system which will switch from bottom tracking to water tracking at increased depth.
  • The Doppler system can be connected with other electronic navigation systems providing generally accurate speed input. The navigator should be cautioned that precise speed should be determined not only by using the Doppler but also from careful calculations of distances between accurate navigational fixes.

Errors in a Doppler log & how are some of these errors overcome by the Janus Configuration:

ERRORS OF DOPPLER LOG:- The Log speed indicated is subject to various errors, spanning installation, equipment, data processing, varying propagation conditions and sea conditions.

  • Error in transducer orientation:- The transducers should make a perfect angle of 60° with respect to the keel or else the speed indicated will be inaccurate.
  • Error in oscillator frequency:- The frequency generated by the oscillator must be accurate and constant. Any deviation in the frequency will result in the speed showing in error.
  • Error in propagation:- The velocity of the acoustic wave at a temperature of 16°C and salinity of 3.2% is 1505 m/sec but taken as 1500 m/sec for calculation. This velocity changes with temperature, salinity and pressure. To compensate the error due to temperature change, a thermister is mounted near the transducer and change in velocity of the acoustic wave through the water from the standard value due to the change in sea water temperature is accounted for.
  • Error in ships’ motion:- During the period of transmission and reception, the ship may have a marginal roll or pitch and thereby the angle of transmission and reception can change and a two degree difference in the angle of transmission and reception can have a 0.10% error in the indicated speed, which is marginal and can be neglected.
  • Error due to rolling/pitching:- The effect of pitching will cause an error in the forward speed and not the athwartship speed. Similarly, rolling will have an effect on the athwartship speed, not the forward speed.

Actual speed = Indicated speed/Cosß

  • Error due to inaccuracy in measurement of frequency:- The difference
    in the frequencies received by the forward and aft transducers must be measured
    accurately. Any error in this will be directly reflected in the speed of the
    vessel.
  • Error due to side lobe:- When the side
    lobe reception dominates over the main beam reception, there will be an error
    in the speed indicated. The error is more pronounced on a sloping bottom as the
    side lobe is reflected at a more favourable angle and will have path length
    less than the main beam. This error can be eliminated with the help of the
    Janus configuration and to reduce this error, the beam of the transmitted
    acoustic wave is reduced.

THE ‘SPEED’ FORMULA WITH SHIP MOVEMENTS CORRECTION – JANUS CONFIGURATION:-

As the ship moves forward, she also has an up and down motion in the vertical direction, called ‘heaving’. The vertical motion component is v sin α.

Working of a Doppler Log

As this movement of the ship has an effect on the frequency shift, it should be accounted for. This is done by installing a second set of transducers (for transmitting and receiving) in the aft direction at the same angle of 60º. (Refer figure). This type of installation setup is called Janus Configuration.

The effect of frequency shift due to vertical motion (the component v sin α ) of the ship gets cancelled out in Janus Configuration and the resultant ship speed is calculated by the formulae:

v = c (Frf – Fra) / 4 Ft cos α

Where,

  • v= ship’s speed
  • c= speed of acoustic wave in water
  • Frf = Freq. of the received wave, from fwd direction
  • Fra = Freq. of the received wave, from aft direction
  • Ft = Freq. of the transmitted wave
  • α = angle of acoustic wave transmission

Posted on

Auto Pilot on Ships

Working of a Ship’s Auto Pilot with Sketch:

Block Diagram of Ship's Auto Pilot
Block Diagram of Ship’s Auto Pilot
  • An auto pilot is the ship’s steering controller which automatically manipulates the rudder to decrease the error between the reference heading and actual heading.
  • Autopilot relieves the helmsman to great extent but definitely autopilot is not a substitute for helmsman.
  • Autopilot also reduces fuel consumption as the zig-zag course is avoided.

Working of Auto Pilot:-

  • Course is selected by the course selector.
  • Present heading is indicated by the compass.
  • The output from the compass is fed to the comparator in the control unit. The signal from the course selector is also fed to the comparator.
  • Difference between the two signals is causing the output error signal detected by the comparator.
  • Integrator and differentiator also analyze the signal.
  • The signals from the comparator, integrator and differentiator are fed to summing amplifier (control unit).
  • The summing amplifier in turn, passes the signals to error amplifier which also receives feedback from the steering gear.
  • The output of error amplifier is transmitted to steering gear via telemotor transmitter and telemotor receiver.
  • A torque motor may be fitted instead of a telemotor.

Controls available in Auto Pilot console:

The Autopilot Control Unit – The PID Control Unit:- In order to maintain the ship’s course accurately, the deviation signal has to be generated under the following conditions:

  1. When the set course is changed (by the navigator).
  2. When the ship deviates from the set course (due to external factors).

For this purpose, the helm must be provided with data regarding the ship’s movement relative to the course to steer line.

This is achieved by electronic circuits with the help of the following:

  • Proportional control
  • Derivative control
  • Integral control

Proportional Control:-

Proportional Control - Auto Pilot
Proportional Control – Auto Pilot
  • The effect on steering, when only the proportional control is applied, causes the rudder to move by an amount proportional to the off-course error from the course to steer.
  • When the ship has gone off-course to port, an error occurs and helm, proportional to the deviation and hence error signal, is used to bring her back to the set course.
  • As the ship starts to return to the set course, the helm is gradually eased and finally removed when the ship is back on the set course.
  • The rudder will be amidships when the ship reaches its set course and then the heading overshoots resulting in the vessel to go more to starboard. Correcting helm is now applied causing the ship to return to port and back to the original course.
  • The vessel thus keeps on oscillating to port and starboard of the course line.

Derivative Control:-

Derivative Control - Auto Pilot
Derivative Control – Auto Pilot
  • In derivative control, the rudder is shifted by an amount proportional to the rate of change of the ship’s deviation from the course. Any deviation of course to port will cause correcting rudder to be applied to starboard.
  • As the rate of change of course decreases, the automatic rudder control decreases and at a point X, the rudder will return to midships before the vessel reaches its set course.
  • The ship will now make good a course parallel to the required course.

Integral Control:-

Integral Control - Auto Pilot
Integral Control – Auto Pilot
  • Certain errors due to the design of the ship (bow going to port due to transverse thrust, shape of the hull, current draft, etc.) have an impact on the steering capabilities of the ship and have to be corrected for effective overall steering performance.
  • In order to achieve this, signals are produced by sensing the heading error over a period of time and applying an appropriate degree of permanent helm. The rudder used to correct the course will now be about this permanent helm. That is, the permanent helm will now act as midships.
  • Additionally, there are various controls provided on the autopilot system along with a filter system for the action of the winds and waves which supply more data to the autopilot which optimizes the performance of integral control.
  • The output of these three controls is combined and the net resultant thus obtained drives the rudder maintaining the ship on the set course. This type of auto pilot is referred to as PID auto pilot.

Working of “Weather Control” in Auto Pilot System:

Rough weather and hostile sea conditions have adverse effects on the performance of the auto-pilot. Uncontrolled yawing of the ship can result in excessive rudder movement. Modern auto-pilot system has Weather control option in which the system automatically adjusts the setting to adapt to the changing weather and sea conditions. It also provides an option for the user to manual set a specific value.


Working of Yaw Controlin Auto Pilot System:

The setting of the Yaw Control depends upon the wind and weather condition and their effect on the course keeping ability of the ship, in bad weather this setting should be set high and calm weather this should be set low. If Yaw Control is not set properly, the steering gear will over work & there will be excessive load on the system.


Working of “Off Course Alarm” in Auto Pilot System:

Off Course Alarm:- Usually an Off Course Alarm is fitted on the Autopilot. This can be set for the required amount of degrees. So that if at anytime the difference between the actual course and the Autopilot set course is more than the preset degrees, an alarm will warn the officer.

There is however, one limitation which should be noted. In case, the gyro compass itself begins to wander the Autopilot well steer so as to follow the wandering compass and the Off Course Alarm will not sound. It does not ring unless the difference between the course setting and gyro heading is more than the preset limit.


Working of “Rudder Limit” in Auto Pilot System:

Rudder Limit:- This setting specifies the maximum amount of rudder to be used when correcting the ship’s head or when altering course on autopilot. That is, if a setting of 10O is applied for rudder limit, when altering course the rudder will move to a maximum of 10O. This limit can be varied according to the requirements of the navigator.


Purpose of following settings in Autopilot: Rudder

  • This control determines the amount of rudder to be used to correct the slightest amount deviation from the set course.
  • The higher is setting the larger the rudder angle is used to correct a course deviation and this may result in over correcting.
  • But if setting is less, the rudder angle is used to correct deviation may not be sufficient and will take longer time to return to set course.
  • This is proportional controller which transmits a signal which is proportional to course error
    • Controller output = constant (Kp) x Deviation
  • The ratio can be changed by settings (i.e. the ratio between instantaneous heading error and rudder command) also called rudder multiplier.
  • Control Knob alters the ratio of output.
  • Higher setting – Larger rudder angle (results in overcorrecting – overshooting)
  • Lower setting – Less rudder angle (Long time to return to set Co-Sluggish).
  • Therefore, optimum setting required.

Purpose of following settings in Autopilot: Counter Rudder

  • This control determines the amount of counter action by the rudder to be used to steady the ship on the set course keeping the overshoot to minimum.
  • Too low setting will allow the ship to overshoot and too high setting will bring the ship back in long time. 
  • This is Derivative control.
  • Purpose is to apply a relatively greater amount of helm at the beginning of a course alteration to get the ship turning. Once the ship is turning, just enough helm is applied in order to keep her coming around. When new heading is approached, opposite helm is applied to stop the swing. As the ship settles on new heading and the yaw rate disappears, the helm is removed.
  • Produces an output when course of vessel is changing.
  • Depends on rate of change of course:
    • Controller output = constant ( KD ) x change of error / time
  • Determines amount of counter rudder to steady the ship on set course.
  • Keeps over shoot to minimum.
  • Greater the ship’s inertia, greater the setting required. If ship has good dynamic stability, relatively small settings of counter rudder will be sufficient. If the ship is unstable, higher settings will be required.
  • Depends on ship’s characteristics, loaded/ballast conditions and rate of turn.
  • Too high setting will bring the ship to set Co slowly.
  • Too low setting allows overshoot.
  • As counter rudder settings increase, counter rudder increases.
  • KD – Counter rudder time constant (Calibration done at sea trial to set KD).

Purpose of following settings in Autopilot: Constant Helm

Constant / Permanent Helm:

  • This is integral controller. (In NFU this control is out of action).
  • When ship has known imbalance to one side, requiring a certain amount of bias helm (e.g. TT of propeller) manual setting of the approximate bias speed up the effect of the AUTOMATIC PERMANENT HELM calculator, because it started off nearer to its target.
  • Whether the control setting is estimated correctly or left at zero has no effect on the final steering accuracy but only in the time it takes to reach this heading accuracy.
  • If not used as described above , the permanent helm should be left at ZERO and the automatic permanent helm will function normally.
  • Produces output as long a course error persists.
  • Used when beam winds; couple formed causing ship to turn into wind.
  • Rudder position required to counteract is permanent helm.
  • Continuous control calibrated from 20 (P) to 20 (S).

Purpose of following settings in Autopilot: Weather

The setting of the yaw control depends upon the wind and weather condition and their effect on course keeping ability of the ship in bad weather this setting should be set high and calm weather this should be low.


Purpose of following settings in Autopilot: Rudder Limit

Rudder limit: This control specifies the maximum amount of rudder to be used, when correcting the ship’s head or altering the ship’s course.


Auto Pilot should not be used in the following conditions:

  • In narrow channels.
  • At slow speeds.
  • During manoeuvring.
  • During pilotage.
  • During heavy weather conditions.
  • During large alteration of course.
  • Near or in area of restricted visibility.
  • When passing close to vessels etc.