Below is the list with short description of all the possible certificates and documents which are related to cargo expected to be carried in a bulk carrier:-
1. Hold inspection certificate: The hold or hatch inspection certificate, or preloading survey certificate, is issued by a surveyor after inspecting the holds to ensure that they are suitable for the intended cargo.
A preloading survey is required when the local authorities at the loading port or the shipper demand it or when it is a charterparty requirement. When a survey is required, loading cannot commence in a hold until the surveyor has passed it. Often the vessel cannot present notice of readiness until the hold inspection certificate has been issued. If any holds fail the survey, a vessel on time charter may be placed off hire and a vessel on voyage charter may fail to start time running against charterers until such time as the holds have been resurveyed and passed, although it may be possible to have some holds passed so that the vessel can submit a valid notice of readiness and/or commence to load in suitable holds.
The surveyor will provide the hold inspection certificate for whoever instructs him, but a copy will normally be given to the Master. The Master has no powers, except the power of reason, to require the surveyor to alter a negative conclusion. But if the Master considers that the surveyor’s conclusions are unreasonable and if the consequences are likely to be costly, the Master can set out his views in writing in a letter of protest or he can obtain services of another surveyor, perhaps with the help of the ship’s P&I club. A second surveyor cannot overrule the first, but can provide evidence of the facts for use in a dispute.
2. Mate’s receipt: A mate’s receipt is usually a printed form, often with handwritten entries which acknowledges on behalf of the ship the receipt of the goods. It is evidence that the goods specified in it have been delivered to and received by the ship (It is signed by chief officer of the receiving ship). Usually the person to whom the mate’s receipt is given is the person entitled to a bill of lading in exchange for the return of the mate’s receipt.
When any damaged or deficient cargo is delivered to the ship it should immediately be brought to the attention of the shippers or their agents so that it can be removed and undamaged cargo supplied in its place. This requirement should be confirmed in writing to provide a record in the event of a dispute. Alternatively, clausing (qualifying words) can be inserted to describe the condition of the goods at the time of delivery. As it is a common requirement that bills of lading should be issued in accordance with mate’s receipts, if damaged cargo is not removed it will be necessary to clause the mate’s receipt which will then lead to clausing of the bill of lading.
3. Authorization to sign Bills of Lading: Under the terms of many time and voyage charterparties the owners transfer the authority to sign bills of lading to the charterers or their agent, thereby cancelling the authority normally held by the Master. In any case in which the agent will be signing bills of lading on behalf of the Master, the master should ensure that the agent receives appropriate instructions in the form of authorization. The wording of any such authorization is often dictated by owners or charterers voyage instructions.
4. Bills of Lading: A bill of lading may perform three functions. (A)It is usually very good evidence of the terms of the contract for the receipt, carriage and delivery of the cargo.(B)It is often a negotiable document of title to goods carried, providing evidence of ownership of the cargo, and(C)it acts as a receipt of cargo loaded aboard the vessel.
5. Phytosanitary Certificate: This certificate may be required during the carriage of plant or plant products like, grain, seeds and fruits. Phytosanitary certificates are issued by inspectors in the exporting country to certify the requirement of the plant health regulations of the importing country has been met.
6. Certificate of compliance with exemptions to trade sanctions: When trade sanctions have been imposed on a country, it may still be allowed to import certain commodities such as food and medicines. Ships carrying such exempted cargoes are required to produce a certificate of compliance to the authorities enforcing the sanctions to demonstrate that cargo qualifies for the exemption. These are issued by the exporting governments .A UN approval certificate is also required with this certificate.
7. UN approval certificate: It is a letter from a UN official to the government of a country which proposes to export exempted goods to a country which the subject of UN sanctions. The letter states that the prohibitions in respect of these shipments no longer apply and that the captains of the ships engaged in the trades should be provided with copies of the letter. This letter is provided so that it can be produced to the naval ships operating the blockades against country against whom sanctions are in force.
8. Certificate of origin: It may be required for a cargo, when the authorities in the destination port are applying against another country and require to be satisfied that the cargo does not originate there, or where the origin of cargo must be documented as per the sale contract. This certificate is often issued by a government department, stating the country of origin of the cargo. In some cases authorities will accept ship’s cargo manifest as evidence of the origin of the cargo.
9. Declaration by shipper: It is made in compliance with the requirement of SOLAS that before loading the shipper should provide to the Master details of any bulk cargo, so that Master can make decisions such as trim of cargo and safety precautions to be observed with respect to the loading and carriage of the cargo.
10. Certificate of transportable moisture limits: The transportable moisture limit of the cargo which may liquefy is the maximum safe moisture content of the cargo when carried in a bulk carrier. Practically, this figure is normally included in the declaration by shipper.
11. Certificate of moisture content: The moisture content of a sample of cargo is the quantity of water, ice or other liquid which the sample contains, expressed as a percentage of total wet mass of that sample. In practice this figure is included in the shipper’s declaration. If the moisture content is higher than the transportable limit, the cargo may liquefy and cause the ship to become unstable.
12. Master’s response sheet: This document is issued by some coal shippers to encourage Masters to comply with the General Requirement 15 of the coal section of IMSBC code. This states:’ If the behavior of the cargo during voyage differs from that specified in the declaration by shipper, the Master should report such differences to the shipper. Such report will enable the shipper to maintain records on the behavior of the coal cargoes, so that the information provided to the Master can be reviewed in the light of transport experience.’ The Masters are encouraged to complete and return these to report any unexpected experiences with coal cargoes.
13. Certificate of lashing: The Master may be required to sign a certificate of lashing to state that the securing of a timber deck cargo or a cargo steel coils or other cargo which requires lashing has been to his satisfaction. After signing the certificate the Master retains one copy and other copies are given back to the foreman responsible for the lashing.
14. Certificate of readiness to load: This certificate is issued by the marine authorities in respect of cargoes of grain and concentrates and timber deck cargo, each of which has special loading requirements. The certificate is issued after satisfactory inspections of cargo spaces and pr-loading calculations and contains reminders of restrictions that must be imposed upon loading.
15. Certificate of fitness to proceed to sea: This follows the certificate of readiness to load, being issued by the marine authorities after satisfactory completion of loading of a cargo of grain or concentrates, or a timber deck cargo. As obvious this certificate records the manner in which the cargo has been stowed and provides reminders of precaution which must be taken during the voyage. It also contains details of the vessel’s draught, trim, weights carried and stability on sailing.
16. Certificate of Loading: A certificate of loading (bulk grain only)is issued in the USA by the National Cargo bureau to certify that a cargo of bulk grain has been loaded as per USCG regulations. The document is similar to the Canadian certificate of fitness to proceed to sea.
17. Certificate of fumigation: It is issued by the relevant agricultural or other responsible authority and provides the details of the cargo(vegetation and its products cargoes , obviously). A certificate of fumigation is required for two reasons.(A) It will satisfy local the local department of agriculture that the cargo is free of infestation, and (B) It provides the information which enables an authorized chemist to carry out a gas free test.
A clearance certificate is issued by the chemist when tests show that the residual fumigant has been dispersed from cargo spaces. Such certificate is provided by a chemist in the discharge port to ensure that cargo spaces can be safely entered.
18. Certificate of weight and quantity: A certificate of weight and quality is issued by suitably qualified surveyors and samplers and testifies to the quantity of the cargo loaded and to its physical description and analytical specification. In grain trades this is the document on which the mate’s receipt and bill of lading are based.
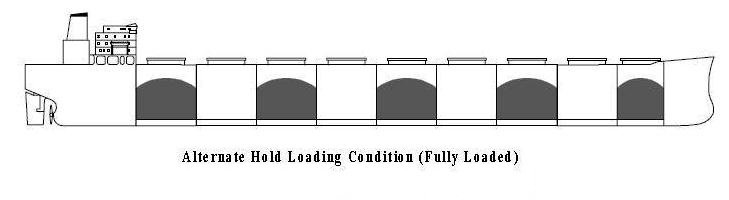
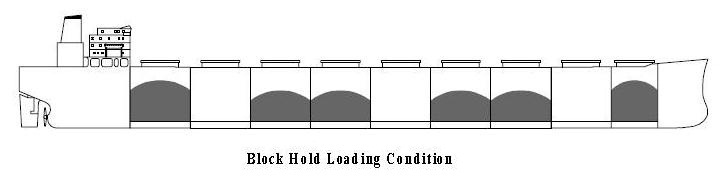
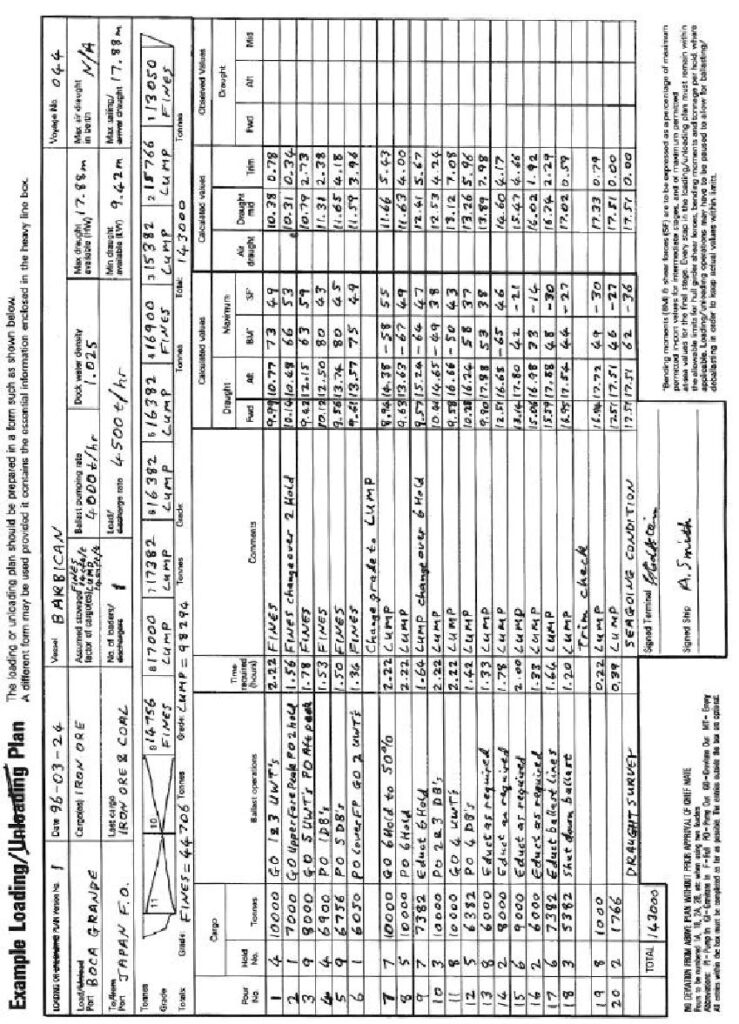
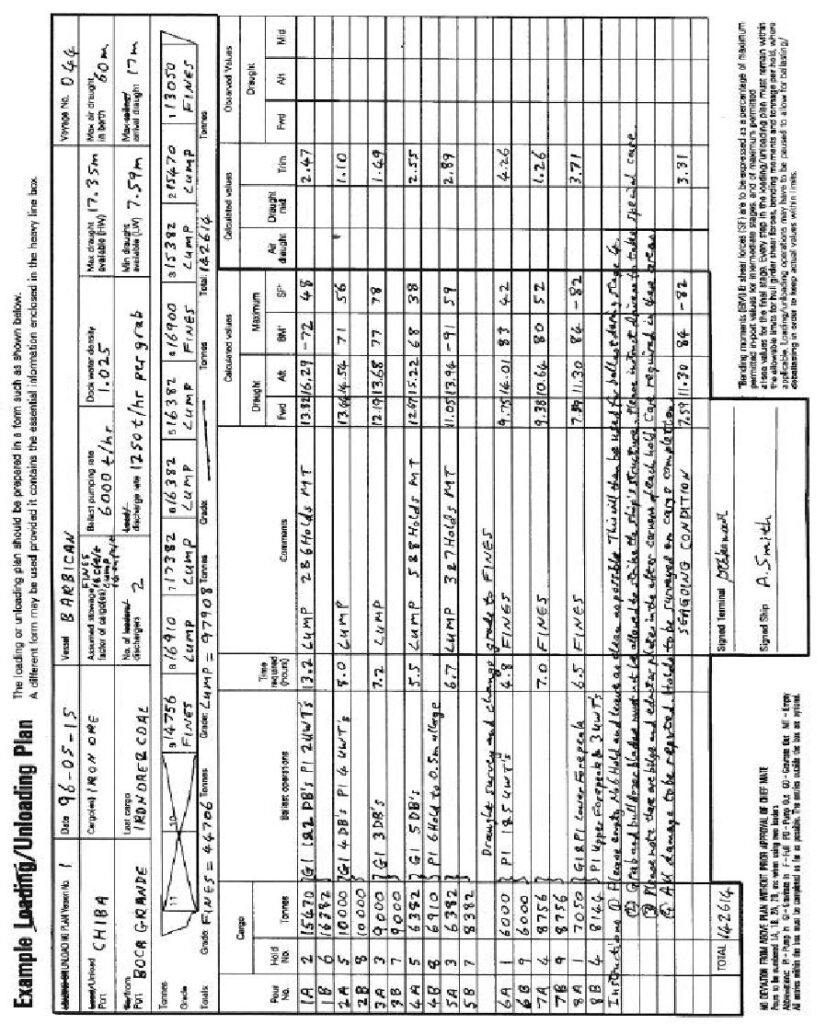
19. Stowage plan: Also known as Cargo plan or the hold distribution plan shows the commodity, tonnage and/or measurement of cargo in each hold. The plan may be produced by one of the ship’s officers to provide a record of the loading as observed and measured by ship’s personnel, in which case it may also provide information about the bunkers carried and the vessel’s draught, trim and stability. Alternatively, stowage plan may be produced by someone from the loading installation to record the quantities loaded in each hold. A stowage plan provide by shore-based staff will normally show the shore values for the tonnages loaded, regardless of whether or not these are the figures used in the bill of lading.
20. Cargo manifest: A cargo manifest is issued by the shippers in the loading port and is based upon the information contained in the bills of lading. It provides brief details of the ship and the loading and discharge ports and list details of the cargo carried. Details include the B/L numbers, contents, gross weight and freight. Copies of the manifest, if available are retained by the master, who will give copies to the authorities in the discharge port or ports visited en-route, if required.
21. Dangerous cargo manifest: It is issued by the shippers in compliance with the regulations which apply at the loading port. The document states the quantity of hazardous material carried and certifies that it has been properly named, prepared and otherwise in proper condition for bulk shipment. The name and description of the hazardous material as given in the Dangerous cargo manifest should be used to confirm the stowage requirements for the cargo, as stated in the IMSBC code and/or IMDG code. The document will be presented to the Master for his signature, and before signing he should satisfy himself, that the stated quantities and positions are correct and that the cargo has been stowed in accordance with the requirements of the codes.
22. Material safety data sheets: MSDS provide detailed information about hazardous cargoes and stores carried on board. It is a must and is issued by the USA. The data includes the useful information about the health hazards and the other dangers associated with the commodity, protective equipment to use, additional precautions, and emergency and the first aid.
23. Health sealing certificate: Cargo hatches may be sealed to prevent theft of cargo or because the holds have been fumigated and are unsafe to enter. When hatches have been sealed by a shore based organization a certificate recording the fact is usually issued, listing the compartments which have been sealed and the type and serial number of the seal used.
24. Statement of Facts: A statement of facts (SOF), sometimes known as a port log, is prepared by the ship’s agents in each loading and each discharging port. It is intended to provide a full record of the times of those events which may be required for the preparation of laytime statement and which may affect claims for dispatch and demurrage or for offhire.
Following things are detailed in the SOF:
- Arrival of vessel at pilot station, the anchorage and the berth.
- Time of pilot boarding and the arrival of tugs.
- Tendering and receipt of notice of readiness.
- Clearing of the holds by the pre-loading surveyor.
- Periods of loading and discharging should be recorded.
- Times of stoppages with their reasons.
- Weather which interrupts cargo work and adverse weather noted at any other time.
- Cargo tonnages, bunker figure and draughts
- Time of fumigation, and any other delays.
- Time of sailing.
25. Letter of protest: It is a document used to provide a written record of dispute. The Master should write a letter of protest whenever he considers that shippers, stevedores or any other parties are responsible for an event or circumstance which will cause a loss to the ship. The Master is liable to receive a letter of protest if vessel fails in some way to perform in accordance with charterparty. A letter of protest should be supported by photographs when they are available.
26. Empty hold certificate: When there is any doubt as to the outrun of the cargo-for example, if the receiver is claiming that the cargo has been short-landed, the Master can issue an empty hold certificate. Such a certificate will say that all cargo has been discharged and that the holds have been emptied. The stevedore supervisor will be asked to confirm that there is no cargo remained on board. The Master will keep the original and can give copies to the stevedore who sign it and to the ship’s agent. Some owners instruct Masters to obtain empty hold certificates for every cargo carried as it is considered a safe commercial practice.
27. Trimming certificate/ certificate of loading/ Discharging: This is a document which the Master may be asked to sign to confirm that he is satisfied with the manner in which the cargo has been trimmed.
The certificate of fitness to proceed at sea issued by port warden, coast guard or similar authority also testifies the trimming of cargo, but the trimming certificate is issued by the Master, not the authorities.
The certificate of loading/discharging goes further and requires the Master or chief mate to state that the cargo has been properly loaded, stowed, trimmed and separations laid according to the signatory’s satisfaction.
28. Stevedores’ time sheet: This normally shows the number of gangs employed, the hatches worked and times and reasons for stoppages. If asked to countersign this document the Master should ensure that it is correct. He should insist on the correction of stevedores’ time sheet when it is inaccurate. Alternatively he can sign ‘for receipt only’.
29. Clean ballast discharge permit: This document is nowadays widely used in many parts of the world. This certificate authorizes the vessel to discharge clean ballast in the port limits and stipulates the conditions which must be observed whilst ballast is being discharged. The permit is issued by the port authority following application from the ship’s agent and a copy has to be posted in ship’s gangway with a record of ‘checks and condition of discharge’.
30. Paint compliance certificate: If holds have been repainted shortly before a cargo of grain or other foodstuffs is to be loaded the shippers may demand to see a compliance certificate issued by an independent laboratory, states that all the materials used to make the paint are approved for the use on surfaces which are in contact with foods.
31. Stevedores damage form: These documents are issued by Master, to hold stevedores responsible for damage to ship or cargo.
32. Certificate of IMO classification: A certificate of IMO classification of a cargo must be issued to the Master by the shipper before shipment of a cargo which is listed in the IMDG code. This is essential so that he can be ready for correct emergency procedures, if they be necessary. Such a certificate is in the form of standardized dangerous goods bill of lading. Copies of the certificate of IMO classification may be required by the receiver and by the port authority in the port of discharge or the ports visited en route.
33. Certificate of compliance/ IMSBS code fitness certificate: These certificates, issued by an Administration or classification society on behalf of an administration to every ship constructed since 1st September 1984, state the dry bulk cargoes that the ship is constructed, equipped and permitted to carry. In addition to listing permitted cargoes the certificates or their supporting documents list the conditions that must be satisfied and equipment that must be carried if the certificate is to remain valid. The certificate for the carriage of dangerous goods must be renewed at each periodical survey.
34. Hatch closing certificate: This is issued by an attending surveyor, reports on hatch covers which appear to be in good condition and which have been properly closed, and has provision for recording hatch covers or fittings which appear to be defective, or which have not been properly closed. This appears to be a document used by shippers or charterers who want to ensure that their cargoes are well protected. The Master or chief mate, when countersigning the document can, if necessary, insert a remark rejecting the report.
35. No damage certificate: In some countries, particularly India, the Master will be required to sign a “ No damage certificate” releasing the stevedores from liability after completion of discharge. The ship may be prevented to sail until the certificate has been signed, in that case Masters can sign the certificate with the endorsement ‘without prejudice’.